Dose-response curves are key metrics in pharmacology and biology to assess phenotypic or molecular actions of bioactive compounds in a quantitative fashion. Yet, it is often unclear whether or not a measured response significantly differs from a curve without regulation, particularly in high-throughput applications or unstable assays. Treating potency and effect size estimates from random and true curves with the same level of confidence can lead to incorrect hypotheses and issues in training machine learning models. Here, we present CurveCurator, an open-source software that provides reliable dose-response characteristics by computing p-values and false discovery rates based on a recalibrated F-statistic and a target-decoy procedure that considers dataset-specific effect size distributions. The application of CurveCurator to three large-scale datasets enables a systematic drug mode of action analysis and demonstrates its scalable utility across several application areas, facilitated by a performant, interactive dashboard for fast data exploration.
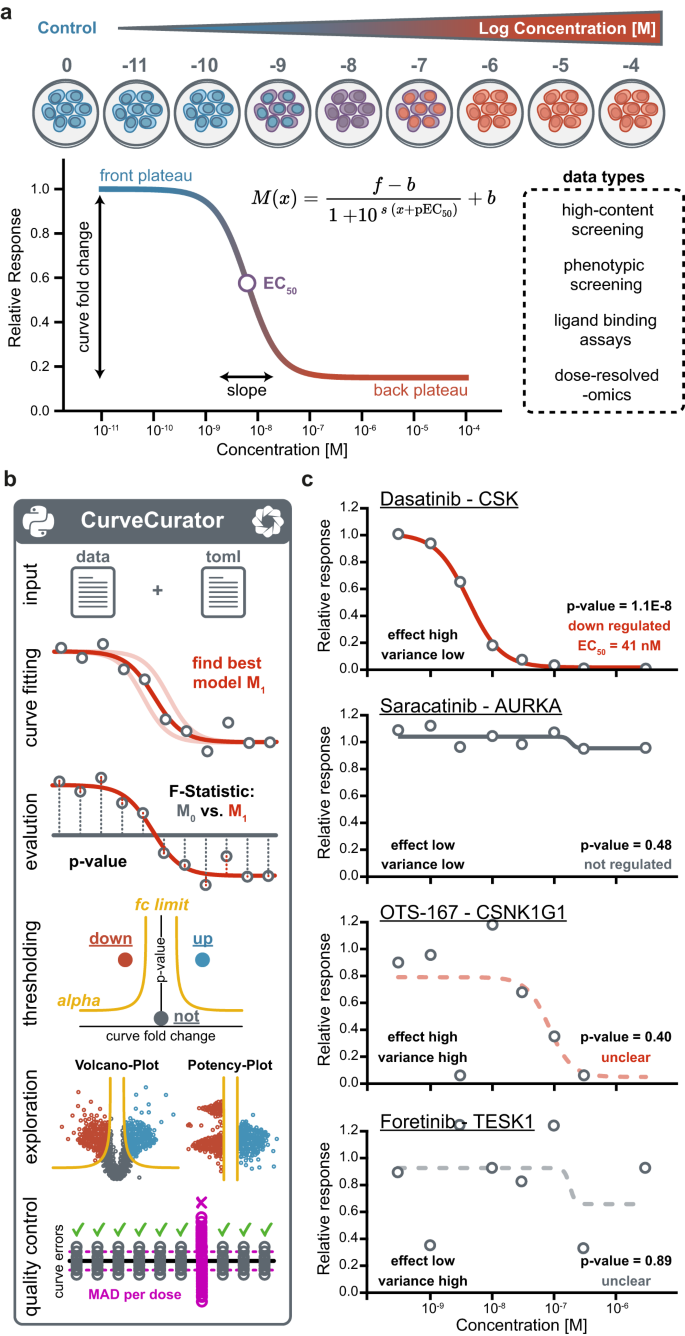
Dose–response analyses are broadly applied in research from drug discovery and pharmacology to toxicology, environmental science, and epidemiology, to name a few. Prominent recent large-scale examples include phenotypic cell viability screens 1,2,3,4 , activity-, affinity- or thermal stability-based drug–target binding assays 5,6,7 , and proteome-wide drug–response profiling of post-translational modifications (PTMs) 8 . Any dose–response experiment quantifies the response variable as a function of the applied dose range and yields two orthogonal parameters: effect potency—the concentration producing the half-maximal response—, and effect size—the magnitude and direction of the response within the observed dose range (Fig. 1a). Determining these parameters from dose–response curves are of immense practical relevance as this can e.g. guide drug discovery and drug repurposing, find the right dose for patients in the clinics, define safety thresholds, and be used to train machine learning models for, e.g., drug response prediction 9 .
Several software tools exist that fit dose–response models and estimate, among other parameters, the effect potency 10,11,12,13,14,15 . Surprisingly, none of them addresses the obvious question of whether the observed curve constitutes a significant regulation or is simply the result of experimental error. Assessing the significance of the regulation is especially relevant for applications in which (i) only a small proportion of cases produces significant regulations, (ii) the effect size is close to the measurement variance of the assay, or (iii) the assay is generally not very stable. So far, dose–response curve classification has required (semi-)manual data evaluation by experts 5,6,7,8,16 , which suffers from inconsistent assessments among individuals and does not scale to the thousands to millions of curves generated by the aforementioned projects.
Fitting a dose–response curve is, in essence, a regression problem. Hence, we propose that the statistical significance of dose–response curves can be assessed using F-statistics. Unfortunately, the log-logistic function typically used for dose–response curve fitting is non-linear and, therefore, F-distributions using the degrees of freedom appropriate for linear models do not describe the true null distribution exactly 17 . The typical solution for complex non-linear models is to use permutation-based statistics, which has been done for time-series data, where the response is not expected to follow a sigmoidal shape 18 and thermal stability data, where temperature and dose result in 2-dimensional models 19,20 . However, we demonstrate here that the simplicity of the log-logistic function allows the estimation of “effective” degrees of freedom for the F-statistic to obtain well-calibrated p-values without the need for permutation strategies. This reduces the computational burden and allows accurate p-value estimation even in the very low p-value region.
Moreover, it is well-established that multiple testing correction is an essential step in the analysis of high-throughput studies 21,22,23 , but often only few significant hits remain after the application of such corrections in differential expression analyses of high-throughput studies 24,25 . A popular approach to alleviate this issue is to add a fudge factor (“s0”) to the denominator of the t-test to penalize low effect size differences 26 , a principle adapted from the Significance Analysis of Microarrays (SAM) test 27 . It has rightfully been pointed out that this correction results in incorrect p-values and violates the original purpose of the SAM-test 28 . Here, we demonstrate for the first time that the s0 principle is valid when combined with a target-decoy approach for multiple testing correction 22,23 . In the context of dose–response curves, this allows filtering of curves by both curve significance and curve effect size, leading to a higher sensitivity for biologically relevant dose responses.
Here, we introduce CurveCurator, a tool that estimates p-values for each dose–response curve from a recalibrated F-statistic. Curves are then classified as significantly up-, down-, or not regulated with low error rates using a procedure for multiple testing correction called the relevance score. An interactive dashboard enables rapid and visual exploration of high-throughput datasets. Finally, the application of CurveCurator to viability, drug–target binding assays, and proteome-wide drug–response profiling demonstrates its scalable utility across several application areas as well as its power to support drug mode of action(s) (MoAs) analyses.
CurveCurator is a free, open-source statistics software for high-throughput dose–response data analysis (Fig. 1b). It is implemented as an executable Python package that is simple to install and use for people with little programming experience. Moreover, the package architecture enables quick integration of CurveCurator into other pipelines. The code is unit- and integration-tested to ensure stability and to increase robustness for future updates and community collaborations. Multiple steps are parallelized, allowing large-scale datasets to be processed in a matter of minutes. To execute the pipeline, users need to provide dose–response data (multiple input formats supported) and a simple parameter file in TOML format to control and customize the pipeline. First, CurveCurator fits a log-logistic model with up to four parameters (pEC50, slope, front, and back plateau) to the dose–response values, and the best model is evaluated regarding its statistical significance using a recalibrated F-statistic. Curve significance is then combined with the curve effect size into a single relevance score that classifies responses into different categories (up, down, not, unclear). An HTML-based dashboard visualizes all curves and the applied decision boundary in an interactive fashion. Applying CurveCurator to high-throughput drug–target binding data exemplifies the different effect-size-to-variance situations commonly present in data sets (Fig. 1c). Only a low-variance high-effect-size curve has a highly significant p-value, and only significant curves have interpretable pEC50 estimates, e.g. the Dasatinib—CSK interaction. Detailed instructions and example datasets are available in the GitHub repository (https://github.com/kusterlab/curve_curator) and supplementary information.
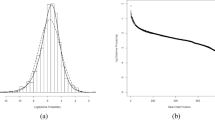
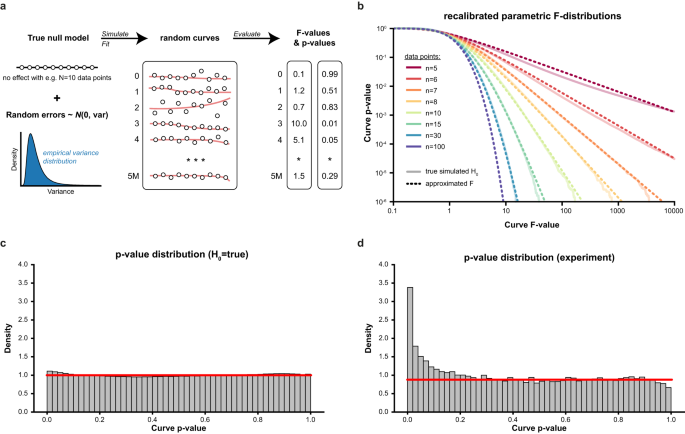
The first step to assess the statistical significance of dose–response curves is to find the best possible fit given the measured dose–response values. As the optimization surface for sigmoidal curves is non-convex (i.e., a surface with many local minima), naïve curve fitting algorithms often get stuck in local minima, leading to suboptimal fits and, thereby, overly conservative p-values (Supplementary Fig S1). CurveCurator uses a heuristic that reaches the global minimum in almost all cases in a short period of time (Supplementary Fig. S2). To obtain an empirical null distribution, we simulated 5 million dose–response curves under the null hypothesis, i.e., curves where the response is independent of the dose (i.e., no dose-dependent regulation) for a range of n data points per curve (Fig. 2a). As expected, direct application of the classical F-statistic for linear models to these null dose–response curves yielded poorly calibrated p-values (Supplementary Fig. S3). CurveCurator solved this issue by optimizing both the F-value formula and the parameters of the F-distribution as a function of n to approximate these simulated null distributions accurately (Fig. 2b, c). The validity of this approach was confirmed by noting that p-values in real experiments in which the vast majority of curves were expected to be unresponsive formed a uniform distribution of truly non-regulated curves plus a small distribution of truly regulated curves enriched at low p-values (Fig. 2d).
CurveCurator classifies dose–response curves into four categories: significantly up-, significantly down-, not-regulated, and unclear. To simplify subsequent investigations, such as training machine learning models, and to obtain highly confident positive (significant) and negative (small effect size and low variance) groups of curves, we consciously introduce the unclear category for high-variance dose–response curves. The obvious approach to identify significant up- or down-regulated dose–response curves would be to use the new p-value dimension directly, i.e., call a curve significant if the p-value is below some significance threshold alpha. However, we observed that highly significant null hypothesis curves tended to have small effect sizes (Supplementary Fig. S4a). Curves with smaller effect sizes are typically less biologically relevant, hard to explain, and may even lead to confusion in downstream analyses such as gene set enrichments. To capitalize on this observation, CurveCurator’s classification uses a hyperbolic decision boundary inspired by the s0 approach of the SAM-test for differential expression analyses 26,27,28 . This decision boundary separates regulations by statistical significance along the p-value axis and by presumed biological relevance along the effect size axis (Supplementary Fig. S4b). Consequently, highly significant but low-effect-size curves are no longer considered regulated, leading to a concomitant reduction of the false positive rate (FPR) at a fixed value of alpha (Supplementary Fig. S4c). For the alpha asymptote, we suggest a default value of 5%, similar to the commonly applied alpha threshold in t tests. The fold-change asymptote depends on the specific assay type and the overall goal of the analysis. We provide further guidance in the supplementary notes. To correctly estimate the false discovery rate (FDR) in real data sets, CurveCurator employs a target-decoy approach that takes the measurement variance of the given dataset into account and computes the FDR for the user-specified decision boundary 22,23 .
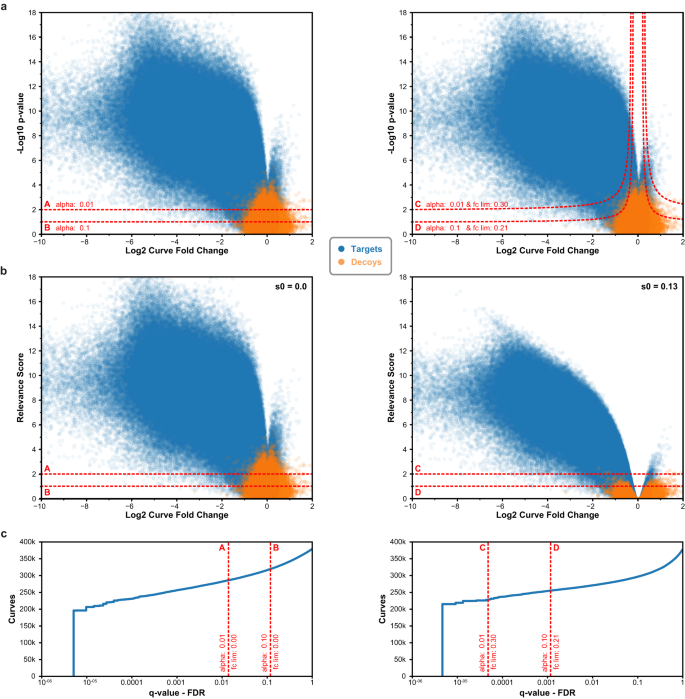
To illustrate how CurveCurator’s s0-based hyperbolic decision boundaries achieve a higher sensitivity to biologically relevant curves in high-throughput data sets, we reprocessed the CTRP cell viability data set 3 with CurveCurator and simulated the corresponding decoy distribution (Fig. 3a). Boundaries A and C used an alpha asymptote of 0.01, whereas B and D used 0.1. Boundaries A and B did not employ a fold change asymptote, whereas boundaries C and D used a fold change asymptote of 0.3 and 0.21, respectively. The hyperbolic decision boundaries filtered away both undesired (highly significant and low-effect-size) curves as well as decoys. To obtain a more intuitive visualization, we developed the relevance score, which is obtained by adjusting each curve’s F-value by the user-specified asymptotes and converting it similarly to a p-value (Fig. 3b; Eq.13). For a fold change asymptote of 0.0, the relevance score simply corresponds to the p-value of the curve, and the curve’s “relevance” is purely defined by its significance. When using a fold change asymptote > 0.0, e.g., boundaries C and D, the relevance score reflects a combination of the curve’s significance and effect size. Due to the statistical component in the relevance score, the absolute value does not describe any tangible biological quantity. Instead, the relevance score is a score that has a stronger discriminative power than the p-value alone. The s0-adjustment manifests in the volcano plot such that: (i) the hyperbolic decision boundary in panel a becomes a horizontal decision boundary at the specified alpha asymptote in panel b, (ii) curves with small effect sizes are penalized stronger than those with big effect sizes, and (iii) relevant curves cannot have a smaller effect size than the used fold change asymptote. Albeit obviously related, it is important to stress that the relevance score is also not a valid p-value 28 . This is because the fold change asymptote strongly reduces the number of false positives at a fixed alpha asymptote. For example, boundaries C (0.005%) and D (0.1%) obtained much lower FDRs compared to boundaries A (1.4%) and B (11.8%) (Fig. 3c).
There is often concern about how pre-defined thresholds will impact the results of an analysis. To examine the influence of different decision boundaries on the set of significantly down-regulated curves, we applied various combinations of alpha and fold-change asymptotes to the same CTRP cell viability data set 3 (Supplementary Fig. S5). We obtained an almost continuous linear trend for both asymptotes over a wide range of possible values, suggesting that slightly altering the asymptotes changes the results only to a small degree. For example, adjusting the fold-change asymptote from 0.3 by ±0.05 expands or reduces the set of significant curves only by about 1.8%. Similarly important is that this observation holds for looser as well as more stringent asymptotes. Overall, this implies that the relevance score constitutes a robust decision boundary.
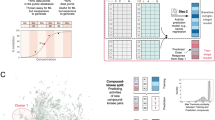
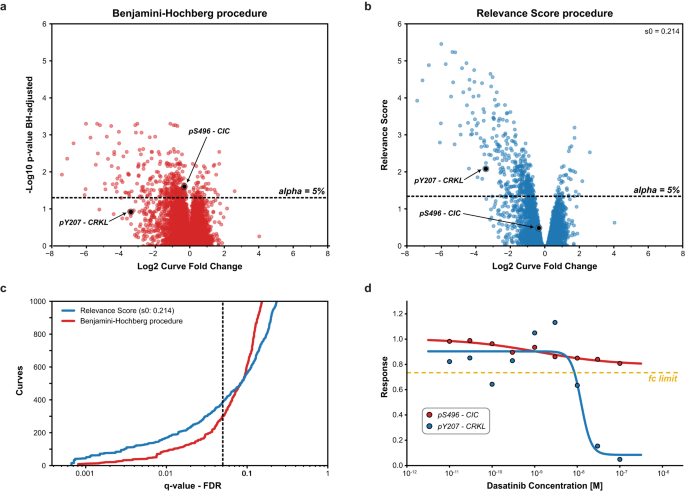
To exemplify the increased power of CurveCurator’s relevance score procedure to identify putatively biologically relevant findings, we compared it to the (effect-size agnostic) Benjamini–Hochberg multiple testing procedure 21 . We reprocessed the drug–PTM dose–response data of the ABL-kinase inhibitor Dasatinib in the BCR-ABL-positive cell line K562 8 . Here, only a few hundred phosphorylation sites (p-sites) were expected to respond to the dose–response treatment, whereas the vast majority of p-sites (>10,000) were expected to be unresponsive (Fig. 4a, b; S6a, b). This scenario requires high statistical sensitivity and is a common case where biologically relevant findings could be obscured in the bulk of data after multiple testing corrections. Two phosphorylation sites are highlighted to illustrate the difference between both approaches. According to PhosphoSitePlus 29 , CRKL pY207 is a known substrate of the tumor-driving fusion kinase BCR-ABL and can be regarded as a true responsive site of Dasatinib treatment. CIC pS496 neither has a functional annotation nor an established kinase-substrate relationship in PhosphoSitePlus 29 . CurveCurator’s relevance score approach retained more regulated curves at low FDRs, including the biologically important site CRKL pY207. At higher FDRs, Benjamini–Hochberg starts calling more dose–response curves regulated compared to the relevance score, such as CIC pS496 (Fig. 4c, d), but these are increasing of questionable biological relevance for understanding the mode of action(s) (MoAs) of Dasatinib in K562. A global comparison of the two procedures further supports this notion (Supplementary Fig. S6). Many of the biologically expected sites were identified by both procedures based on prior knowledge from PhosphositePlus 29 and the KinaseLibrary 30 , and 56% of the intersecting subset of curves can be rationalized by prior knowledge. When focusing on the procedure-specific subsets, only the relevance-score-specific subset possessed a knowledge distribution similar to the intersecting subset, with a high explained ratio of 44%. The explained ratio of the Benjamini–Hochberg-specific subset was only 15%. Furthermore, the relevance-score-specific subset contained ~10x more direct substrates and ~3x more downstream sites relative to the Benjamini–Hochberg-specific subset. This exemplifies the strength of the relevance score in retaining biologically relevant curves while maintaining a low FDR by adjusting curve significance with the curve effect size.
To demonstrate its broad utility, CurveCurator was applied to three dose–response data sets of different kinds, sizes, and proportions of regulated curves. They illustrate how drug–phenotype, drug–target binding, and drug–PTM response data can be linked by taking advantage of multiple aspects of CurveCurator, such as, regulation classification, robust potency estimation, and interactive dashboards. This, in turn, assists in elucidating the MoAs of drugs, exemplified here for the EGFR inhibitor Afatinib. First, the “target landscape of clinical kinase inhibitors” 5 was reprocessed (54,223 dose–response curves; 9% down-regulated), and drug–target classifications obtained by CurveCurator showed 97% consistency with the original manual analysis (Supplementary Data 1). Out of 247 assayed kinases, Afatinib was found to have nine significant interactions (Fig. 5a). As expected, the designated target, EGFR, was the most potent, followed by MAPK14, with a ~100x lower potency. Second, the previously introduced phenotypic CTRP cell viability screen 3 (379,324 dose–response curves: 63% down-regulated, 25% not regulated) indicated that 755 out of 760 cell lines exhibited a significant down-regulation by Afatinib, though the majority of cells showed very weak potency (Fig. 5b). A common misinterpretation of these viability results is to conclude that all cell lines are sensitive to HER inhibition. Instead, due to the consistent potency dimension provided by CurveCurator, we placed the above drug–target binding data and the viability data into a direct context. This allowed a rough classification of cell lines into drug sensitivity groups driven by different targets of Afatinib (e.g., HER, p38 MAPK, and others). Of note, the plasma concentration of Afatinib in approved cancer therapies 31 precisely matches the border between HER-sensitive cells and p38 MAPK-induced cell toxicity 32 , highlighting the importance of understanding the molecular MoAs behind dose–response relationships. Third, to understand the impact of Afatinib-target engagement on PTM-mediated signaling pathways, the decryptM profiles 8 of the EGFR-driven carcinoma cell line A431 were reprocessed by CurveCurator (19,596 dose–response curves: 5% down-regulated, 1% up-regulated, 46% not regulated; Fig. 5c). It is apparent that EGFR inhibition downregulates the direct EGFR substrate GAB1 pY627 at the expected potency. Downstream of GAB1, the MAPK- and AKT signaling axis were also inhibited with similar potencies (indicated by MAPK pT185/pY187 and AKT1S1 pT246) as were multiple transcription factors influencing cell growth such as ETV3, ELK1, and FOS (curves not shown). In contrast, inhibition of MAPK14 activity (monitored by MAPK14 pT180/pY182) only occurred at much higher drug doses, as expected from drug–target binding data.
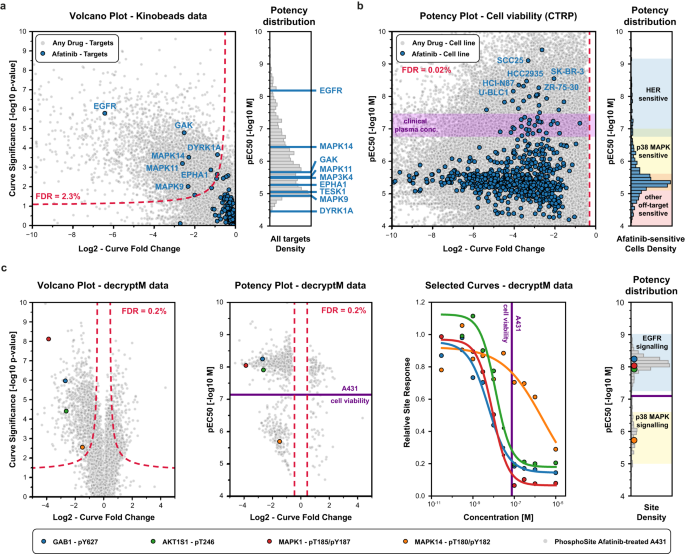
Particularly, when combining the three orthogonal sources of information, the full cellular MoAs of Afatinib in the cell line A431 is revealed: Afatinib binds to EGFR with a KD of ~10 nM in cells (50% target engagement), inhibiting the main driver of this carcinoma and leading to the shut-down of key downstream survival signals. Substantial reduction in cell growth requires the inhibition of the bulk of signaling, which only occurs at ~100 nM (90% target engagement). The observed inhibition of MAPK14 signaling at high drug doses is not relevant to the observed phenotypic response on cell viability.
CurveCurator is the first tool that provides reliable p-values for assessing the statistical likelihood of regulation in dose–response experiments. It does so by fitting the best possible log-logistic model and using a recalibrated F-statistic with optimized effective degrees of freedom. Combining statistical significance with biological effect size results in the relevance score, which provides a simple means to classify curves in large-scale datasets. CurveCurator can assess the FDR of the user-specified decision boundary based on the variance levels of each individual dataset. The easy use and strong visualizations enable researchers to understand dose–response relationships in high-throughput data sets faster and more objectively.
CurveCurator is looking specifically for dose–response shapes that can be described by the 4-parameter log-logistic model reflecting a single drug–target binding event. While this assumption is valid for most experimental settings and curves, there are cases where the dose–response curve is shaped by multiple independent events, resulting in a non-sigmoidal curve shape 12 . The consequence is that CurveCurator cannot properly model the true underlying and complex dose–response relationship, typically resulting in big effect sizes but poor p-values. In the future, we envision that CurveCurator can support a wider variety of models, given that the p-values can also be calibrated for those more complex models. Another current constraint is that the fold change calculation requires the lowest dose to be close to the front plateau to obtain a good estimate. However, if a drug is more potent than the applied experimental dose range, the fold change estimate is compressed, leading to an increased rate of false negatives among the most potent curves. To overcome this, we recommend either choosing the experimental drug range more carefully based on pilot studies or using a modified fold change calculation relative to the control at the cost of increased false positives for unstable assays.
We further point out that one could technically adjust the FDR to a pre-defined threshold by moving the relevance score decision boundary up or down. However, as the relevance score remains unchanged at a fixed value of s0, this will, in turn, adjust both the alpha and fold change asymptotes simultaneously. This can be seen in Fig. 3, where decision boundaries C and D have the same s0 but different significance and fold change asymptotes. Therefore, we explicitly recommend against finding a threshold based on a pre-defined FDR value but instead encourage users to define the significance (statistical relevance) and fold change asymptotes (biological relevance) first and accept the resulting low FDR. Otherwise, in datasets with a high proportion of regulated curves, e.g. the CTRP viability data, increasing the FDR from 0.1% to 10% will inevitably lead to the inclusion of many irrelevant curves with undesirably small effect sizes.
Finally, we stress that only relevant curves have interpretable curve parameters, and this consistent information can only be obtained by a versatile statistical tool such as CurveCurator. The identification of relevant dose–response curves combined with the use of each curve’s pEC50-value enables the direct integration of multiple complementary datasets by harnessing the perhaps most important characteristic of a compound - its potency. Beyond the potency estimates, CurveCurator yields many more parameters and derived values that can describe different aspects of biological systems 33 . All possible downstream analyses should, in principle, benefit from focusing on relevant curves with high sensitivity. An even more fine-grained picture may be obtained by further subgrouping relevant dose–response curves by potency, effect size, or both and comparing, e.g., the gene expression profiles of these subgroups to elucidate more details of the MoAs. Contrasting these subgroups against clearly unresponsive groups can perhaps identify sensitivity or resistance markers 34,35 . In all scenarios, CurveCurator builds the foundation for these analyses.
In conclusion, we have introduced CurveCurator and its underlying relevance score. The relevance score is robust and highly sensitive at similar or often lower FDRs than conventional multiple-testing corrections. The objective categorization of dose–response curves combined with an interactive dashboard accelerates data analysis and fills the need for a helpful tool in times of ever-increasing experimental throughput.
Kinobeads 5 search results and LFQ intensities were downloaded from PRIDE (PXD005336) and filtered for direct binders (255 proteins that can bind to the Kinobeads via an ATP pocket, including 216 kinases). The direct binder list, experimental design table, and manual target annotations were obtained from the original publication. Binders with less than two data points per curve or missing in the control experiment were excluded. The remaining missing values were imputed per experiment using the 0.5% intensity quantile. The resulting Kinobeads matrix consisted of 278 unique drugs with 9 data points each and was subjected to CurveCurator. The alpha asymptote was set to 10%, and the fold change asymptote was set to 0.5.
CTRP Viability data 3 was downloaded using the downloadPSet function of the R package PharmacoGx 11 (R v3.6.3, PharmacoGx v1.17.1). This consisted of 373,324 drug–cell line combinations from 545 drugs and 887 cell lines, each with n = 17 data points (doses and one control). Because the CTRP screen featured many different dose ranges, the data was split into separate CurveCurator input files for each dose range. Note that most drugs were profiled at the same dose range. Missing values were very sparse and missing at random, and therefore, no imputation was performed. For the decision boundaries analysis, four exemplary boundaries were used: A (1%, 0.0), B (10%, 0.0), C (1%, 0.3), D (10%, 0.21) - (alpha, fold change asymptotes). For the robustness analysis of the relevance score, a multitude of different asymptote combinations were applied, and the proportion of down-regulate curves was calculated for each decision boundary. For the MoA analysis of Afatinib, the alpha asymptote was set to 5%, and the fold change asymptote was set to 0.3. Fold change was computed relative to the control instead of the lowest dose, as several drugs showed significant regulation at the lowest dose already. The different dose-range output files were re-combined, and the FDR was estimated once for all curves.
decryptM 8 search results and TMT intensities were downloaded from PRIDE (PXD037285), and the datasets” Dasatinib Triplicates Phosphoproteome MS3” and “3 EGFR Inhibitors Phosphoproteome” were re-analyzed in this paper. Experiments that were searched together were separated and subjected to CurveCurator individually. The experimental design table was obtained from the original publication. For TMT peptide data, the TMT channels were median-centered, and missing values were imputed. Peptides with more than 4 missing values were excluded. The alpha asymptote was set to 5%, and the fold change asymptote was set to 0.45. This fold change asymptote is 46% less stringent than in the original publication, which was solely possible due to the gained specificity of the hyperbolic decision boundary. Cell viability data for A431 was used from the original publication. Kinase-substrate relationships were obtained from PhosphositePlus (release 08/2023) and the KinaseLibrary. For KinaseLibrary predictions, the top 5 kinases with a combined motif-enrichment score > 3 were considered as potential kinases. To account for ambiguity in the site localization in mass spectrometry data sets, we allowed a site position tolerance of ±1 for STY.
More information regarding specific parameters of the analysis pipeline and the rationale behind certain values can be found in the supplementary notes.
Based on empirical decryptM variance distributions, true negative (H0=True) random curves were simulated. First, a variance value ( \(>>>>>>_^\) ) was drawn from the empirical variance distribution, defining the spread of a normally distributed \(N(0,\, >>>>>>_^)\) random error ei with variance \(>>>>>>_^\) for one curve. For each data point n of one curve, a random error ei,n was drawn and added to the null model, which describes the case that the response variable Y is independent of the dose X.
The empirical distribution is stored in CurveCurator, and any H0-simulation can be performed using the --random command line option. Note that F-values and p-values of curves generated under the null hypothesis are independent of the variance value because rescaling the response values affects the numerator and denominator of the F-value equally. However, their estimated fold change does depend on the variance value, which is why such a variance was included in the simulations.
CurveCurator uses two competing models, which are evaluated based on the observed responses (normalized to the control sample; see above). To obtain model parameters, CurveCurator currently supports ordinary least squares (OLS) regression as well as maximum likelihood estimation (MLE). While the mean model (Eq. 2) has an analytical solution, the log-logistic model (Eq. 3, Fig. 1a) does not, and thus requires iterative minimization procedures of the OLS cost (Eq. 4) or MLE negative log-likelihood (Eq. 5) objective functions, respectively.